On Scriptcase, it is possible to configure the Gant graphic exhibition option easily. Using a resource that is available on the application properties in consults, you can edit important configurations leaving your graphic much more customized.
To configure the Grant graphic properties is very simple. Open the properties of your consults type application and click on “Gant Graphic” on the left side menu.
Inside the screen that will open, you can edit the following items:
- The output format is one of the HTML5 options;
- The Label field;
- Width and Height;
- Quantity of months;
- Initial and final graphic date;
- The exhibition format;
- Complete percentage of every activity;
- Resource field exhibition on graphics;
The Gant graphic is utilized to help the project manager and we already talk about it in another opportunity here in our blog.
Tutorial in Scriptcase:
Creating a new grid
1. Create a new grid application based on the following SQL.
SELECT
project.projectname,
tasks.taskid,
tasks.projectid,
tasks.taskname,
tasks.milestone,
tasks.startdate,
tasks.finishdate,
tasks.percentcomplete,
tasks.actualfinishdate,
tasks.daysoverdue,
tasks.taskpredecessor,
tasks.taskstatus
FROM
project, tasks
WHERE
project.projectid = tasks.projectid
ORDERBY
project.projectname,
tasks.startdate
2. Access the item “Field positioning”.

3. Select to display the following fields:

Configuring the filter
4. Return to the “Grid Modules” item and mark “Search” as the initial module.


5. On the Search tab to access the “Advanced filters >> Select fields“

6. Select the tasks.projectid field.
7. Still on the Search tab, visit the task editing field.

8. Change the field type to “Select” and use the following code in the SQL search.
select projectid, projectname
from project
order by projectname
Configuring the Gantt chart
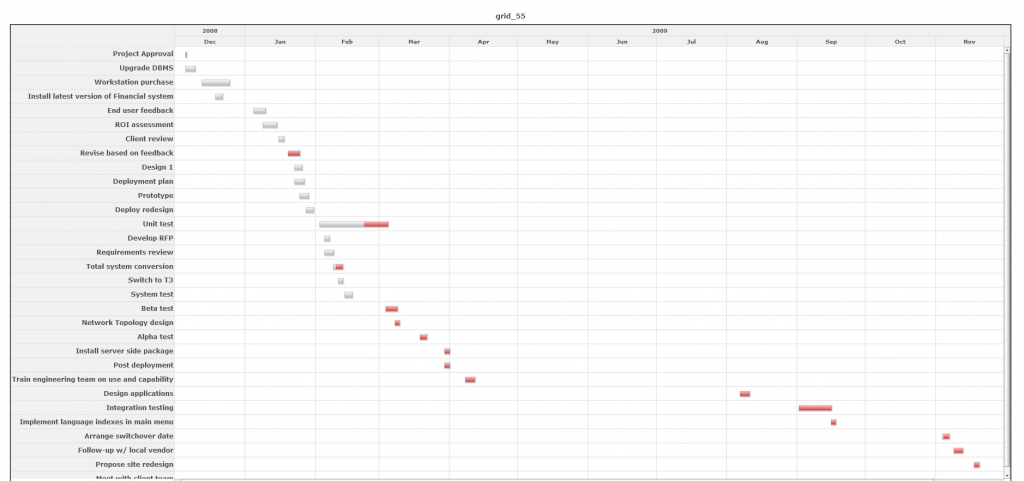
9. Visit the “Gantt” option in the application menu.

10. Set the properties according to the image below.

11. Access the “Toolbar” settings.

12. Select to display the Gantt chart button.

13. Click on the Run button on the toolbar.
Visit our blog and check out more articles like this one!
Learn all about Scriptcase.
You might also like…